Please activate the Compare button on the GATED Analysis page to start the result comparison and continue on the Compare page.
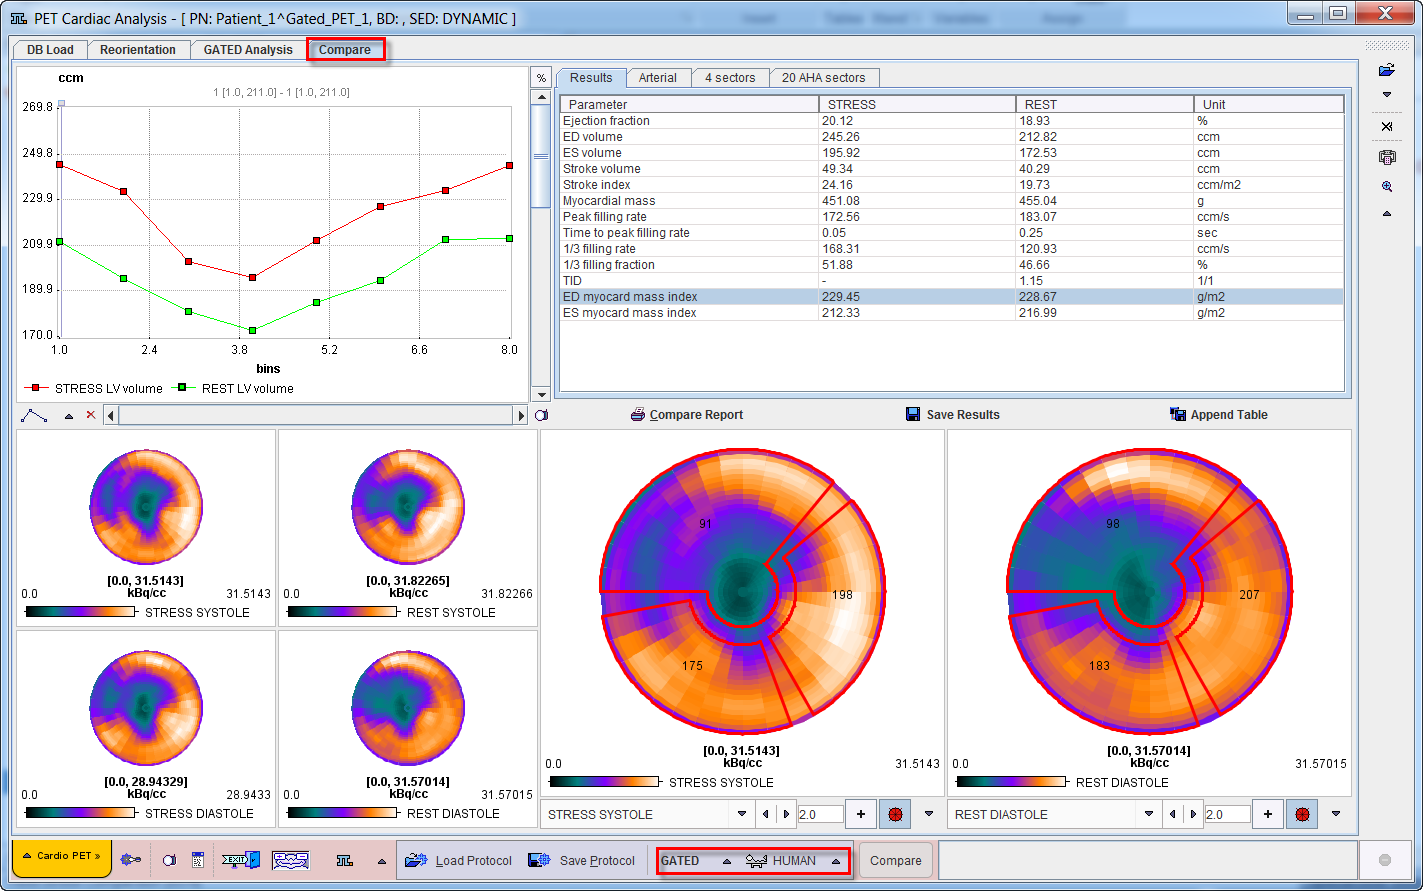
The page is organized in four main areas described below.
Time-Volume Curve Area
The volume curves of the left ventricle at STRESS and REST are shown in the upper left corner as a function of the gate bin.
Polar Maps Areas
The lower left shows polar maps of STRESS and REST uptake at systole and diastole. The two larger polar plots can be configured to show any of the following 8 results:
STRESS DIASTOLE |
Uptake values of the STRESS scan at the end of the diastole. |
REST DIASTOLE |
Uptake values of the REST scan at the end of the diastole. |
STRESS SYSTOLE |
Uptake values of the STRESS scan at the end of the systole. |
REST SYSTOLE |
Uptake values of the REST scan at the end of the systole. |
STRESS TOTAL |
Uptake values of the STRESS scan averaged across the polar plots of all gates. |
REST TOTAL |
Uptake values of the REST scan averaged across the polar plots of all gates. |
REVERSIBILITY |
Difference of the REST TOTAL and STRESS TOTAL polar plots after normalizing them to 1. |
STRESS DIFFERENCE |
Negative of REVERSIBILITY. |
The example below shows the STRESS TOTAL and the REST TOTAL polar plots with interpolation and with the display controls enabled. An overlay showing 3 vascular territories (Arterial), 4 Sectors or 20 segments (20 AHA sectors) can be selected from the pull-down menu to right of the overlay toggle ![]() . By default, Arterial definition is used. The + button allows using an explicitly defined maximum rather than the maximum in the data, which can be specified in the adjacent number field.
. By default, Arterial definition is used. The + button allows using an explicitly defined maximum rather than the maximum in the data, which can be specified in the adjacent number field.
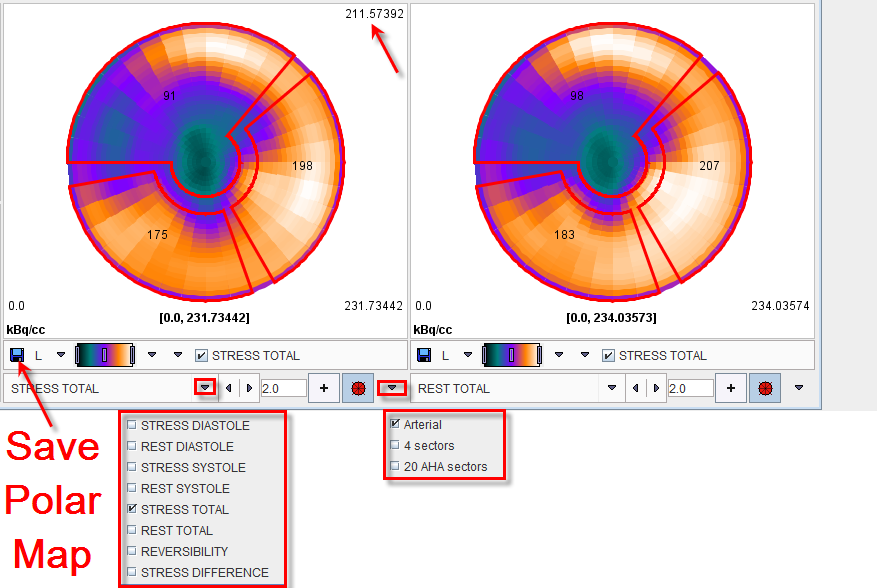
In the polar maps, the numbers associated with the overlay represent the average value of the parameter measured by each map within the territory, sector or segment in which they lie. When the cursor is moved about the polar plot the instantaneous value is shown in the upper right of the corresponding panel.
The polar plots can be saved using the Save icon as indicated above. After saving, the polar plots can be analyzed outside the PCARDP tool, for example in the PMOD-R interface.
By right clicking into the polar plot area a context menu can be opened.

Hide/Show Controls allows enabling/disabling the control elements, whereas Properties gives access to font size etc.
Tables Area
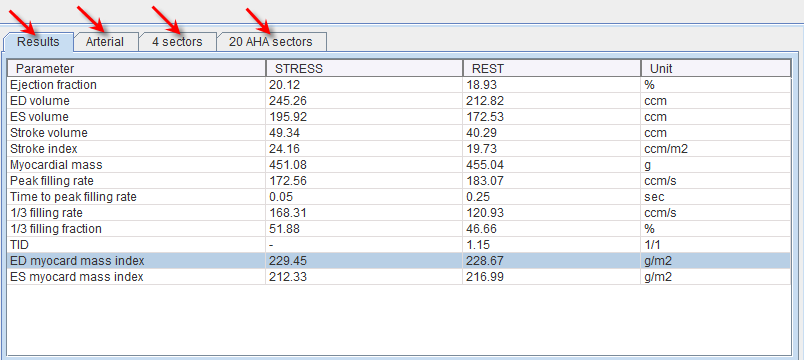
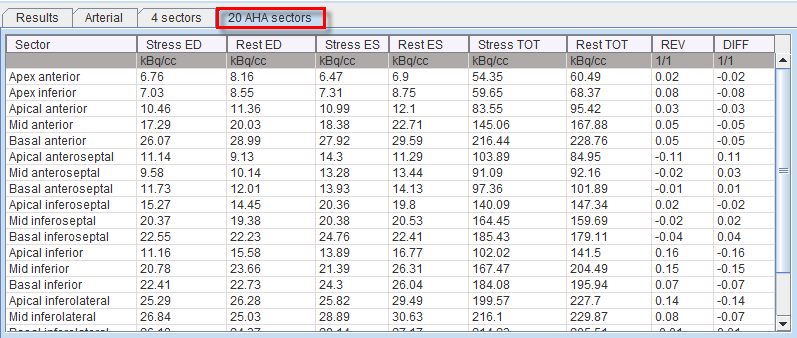
The results of the gated analysis are summarized in four tables accessible via the tabs:


Rest/Stress Summary Report
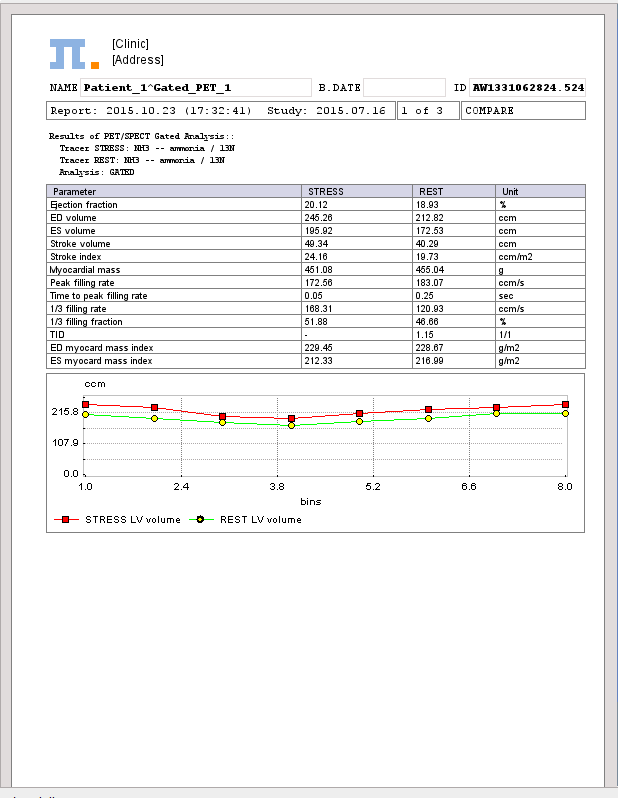
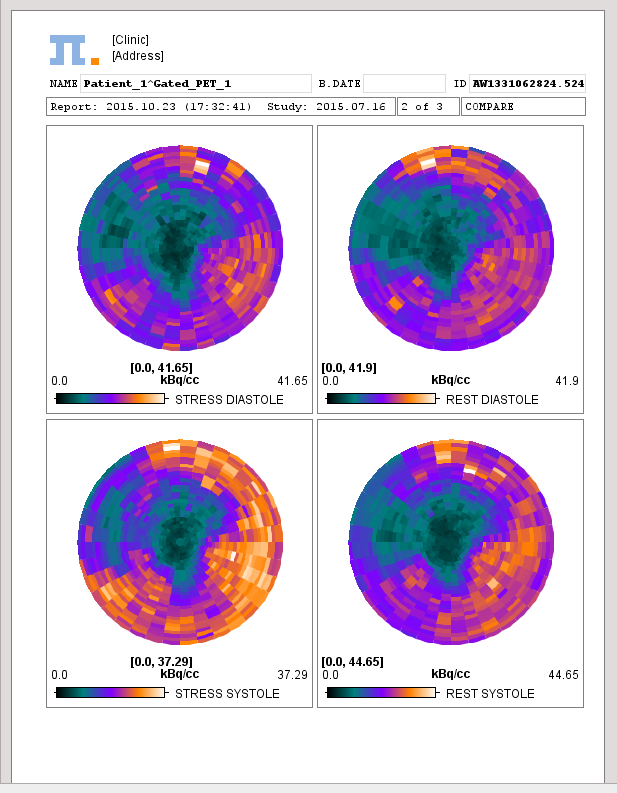
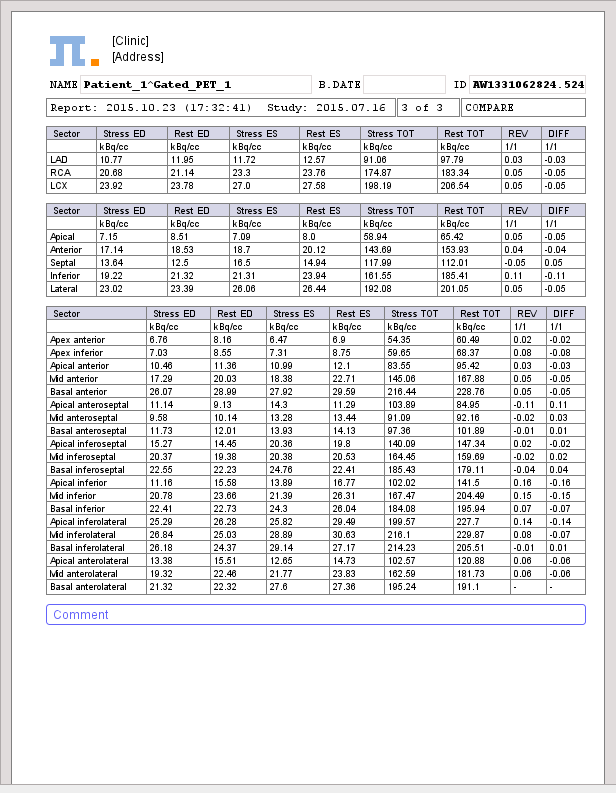
The Compare Report button compiles the Stress/Rest information into a report summary distributed on three pages.
The first page contains Results tab content in the upper section and the volume curves of the STRESS and REST gated studies.
The second page content consist of polar maps of the STRESS and REST uptake at the end of the systole and diastole.
The third page reports in tabular format the content of the Arterial, 4 Sectors and 20AHA sectors tables availble on the Compare page.
As usual with PMOD reports it can be annotated, saved in different formats, and printed.
Saving and Inspecting Numeric Results
The numeric information of Results tab can also be saved or appended to a text file using the Save Results and the Append Results buttons, respectively. The saved file receives a .pcardRes suffix and can be visualized in Excel or a text editor (e.g Notepad).
Two different numeric results can be opened and compared within PCARDP module. This can be easily achived activating the View Results  option from the bottom status line. Initially, a window appears allowing to select either a file from the database or a file located on your system. The
  button activation opens a dialog window.

In the upper part the current path is indicated. The program automatically points to the directory of the last successful loading operation. It has elements for changing the directory: the navigation buttons in the Folder section (.. indicating one level up). All files suitable for loading (having the suffix *.pcardRes) in the search directory are listed in the Files section. The Open button starts loading the selected file, Cancel quits the operation, and Delete erases the file from the disk.
Finally, a comparison window displays in the left section the initial loading results:
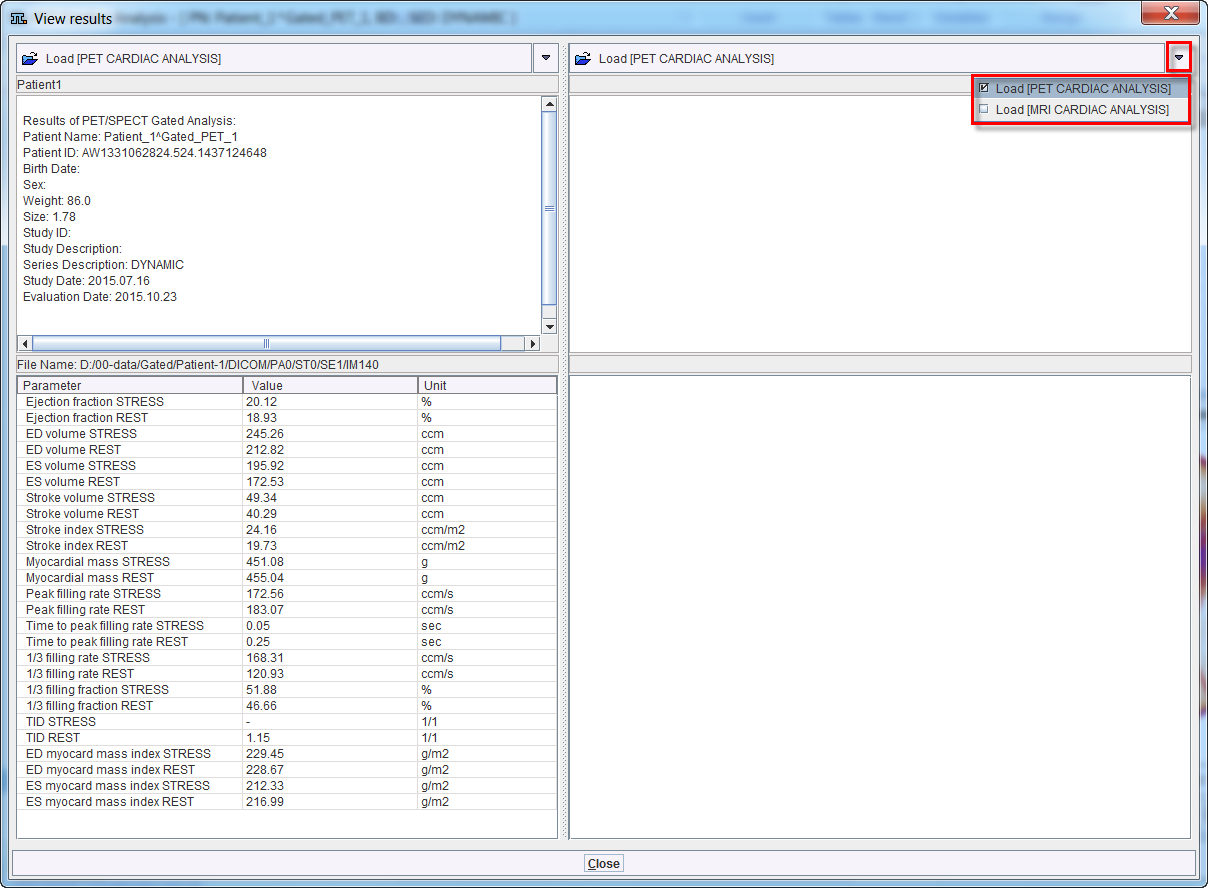
In the right section of the panel the bottom Load button allows loading results obtained either from MRI or PET cardiac analysis for a side-by-side comparison. The Close button exits the comparison window.